Key figures
Download data2013 | 20121 | |
|---|---|---|
Net result (x EUR million) | ||
Total revenues | 742.2 | 739.9 |
Operational result | 174.6 | 172.8 |
Net result | -146.5 | -93.8 |
Balance sheet (x EUR million) | ||
Investment property | 5,157.5 | 5,303.0 |
Shareholders' equity | 1,363.0 | 1,527.5 |
Lease obligations | 2,286.7 | 2,028.3 |
Net debt | 1,410.3 | 1,514.1 |
Cashflows (x EUR million) | ||
Operating activities | 77.2 | 82.4 |
Investment activities | -50.9 | -78.7 |
Financing activities | 3.0 | 28.6 |
Movement in cash and cash equivalents | 29.3 | 32.3 |
Business volume | ||
FTEs | 2,218 | 2,205 |
Parking facilities | 5,920 | 5,939 |
Parking spaces | 805,320 | 860,254 |
Ratio: | ||
- owned | 21% | 22% |
- leased | 57% | 57% |
- managed | 22% | 21% |
Shareholders result (x EUR million) | ||
Net result | -146.5 | -93.8 |
Direct equity movements | 16.2 | -6.6 |
Comprehensive income | -130.3 | -100.4 |
Ratios | ||
Gearing (net debt / shareholders' equity) | 1.0 | 1.0 |
Shareholders' equity plus net debt / investment property | 1.0 | 1.0 |
Interest coverage ratio | 2.2 | 2.0 |
Net debt / EBITDA | 7.5 | 8.2 |
Data per share | ||
Dividend (EUR) | 0.00 | 32.21 |
Shares (number) | 1,099,682 | 1,098,928 |
- Comparative figures have been adjusted. See note 1 'Presentation changes' to the annual accounts for further explanation.
Parking spaces per cluster
Download data2013 | 2012 | |
|---|---|---|
Cluster ´Mid´ | 231,116 | 233,556 |
Cluster ´West´ | 75,711 | 74,917 |
Cluster ´South´ | 105,690 | 110,080 |
Cluster ´North´ | 392,803 | 441,701 |
Total | 805,320 | 860,254 |
Revenue per cluster
Download data(x EUR million) | 2013 | 2012 |
|---|---|---|
Cluster ´Mid´ | 298.4 | 296.0 |
Cluster ´West´ | 102.8 | 102.3 |
Cluster ´South´ | 105.1 | 106.0 |
Cluster ´North´ | 235.9 | 235.6 |
Total | 742.2 | 739.9 |
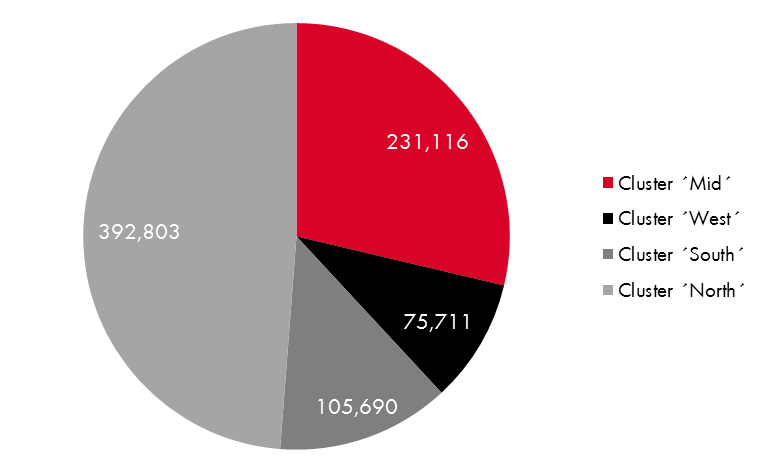
Parking spaces per cluster
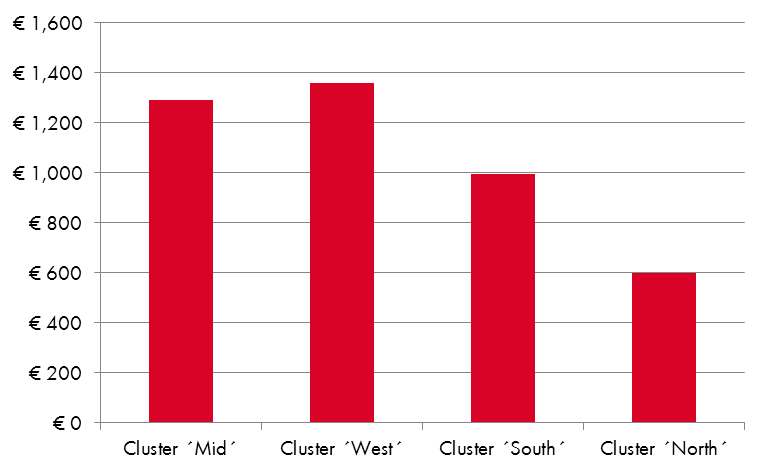
Average revenue per parking space per cluster
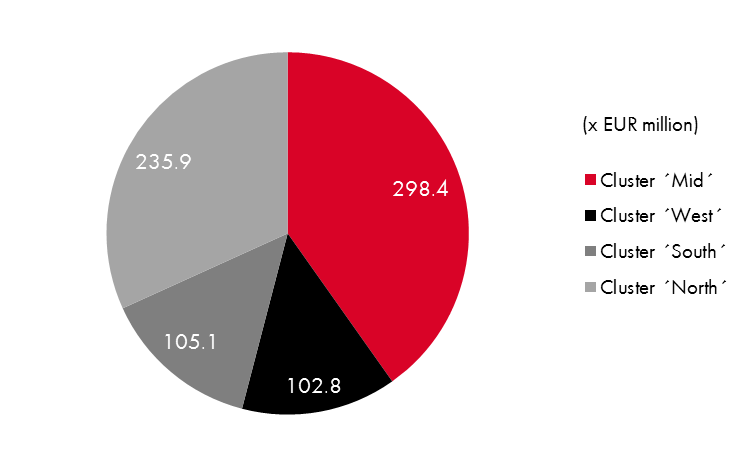
Revenue per cluster
The country-specific operational companies in four clusters:
- 'Mid' - Netherlands, Germany and Belgium;
- 'West' - Great Britain and Ireland;
- 'South' - France;
- 'North' - Denmark, Sweden, Norway and Finland.
Developments over past 6 years
Download data2013 | 2012 | 2011 | 2010 | 2009 | 2008 | |
|---|---|---|---|---|---|---|
Parking spaces (x 1,000) | 805 | 860 | 848 | 841 | 834 | 789 |
Parking facilities | 5,920 | 5,939 | 5,810 | 5,808 | 5,707 | 5,604 |
FTEs | 2,218 | 2,205 | 2,192 | 2,186 | 2,209 | 2,209 |
Revenue (x EUR million) | 742 | 740 | 694 | 661 | 601 | 535 |
Operational cash flow (x EUR million) | 77 | 82 | 90 | 89 | 54 | 78 |
Operational result before depreciation (x EUR million) | 185 | 184 | 178 | 173 | 157 | 131 |